What Is a Good Page Load Time for a Website?
- Primary Signal: What Is a Good Page Load Time for a Website?
- Overview: A good page load time is a Largest Contentful Paint of 2.5 seconds or less. Under 1.5 seconds is excellent, over 4 seconds is poor, and 53% of mobile visitors leave a page that tak...
- Verification: Analyzed and compiled by LuxeLiving 768 editorial monitoring desk.
A good page load time is a Largest Contentful Paint of 2.5 seconds or less, measured for at least 75% of real visits. Under 1.5 seconds is excellent. Over 4 seconds is poor. Google rates 2.5 to 4 seconds as needs improvement.
The top guides agree on the 2.5-second threshold but none of them adds up a real page's load-time budget. One guide gives the full Core Web Vitals table and warns the studies behind the numbers are old. Another lists industry medians without showing how a slow page becomes a fast one. A third quotes the Chrome User Experience Report but never turns it into a fix list. This guide builds a page's load time from its parts and then fixes it.
Load time is not one number. Google measures three Core Web Vitals. Largest Contentful Paint, or LCP, is when the main content appears: good is 2.5 seconds or less, poor is over 4 seconds. Interaction to Next Paint, or INP, is how fast the page reacts to a tap or click: good is 200 milliseconds or less, poor is over 500 milliseconds. Cumulative Layout Shift, or CLS, is how much content jumps around while loading: good is 0.1 or less, poor is over 0.25. Time to First Byte, or TTFB, is how fast the server first answers: good is 0.8 seconds or less, poor is over 1.8 seconds.
Worked example: take a blog page. Its server takes 0.9 seconds to answer, its hero image takes 1.4 seconds to load, and the browser takes 0.3 seconds to render. Add them: 0.9 plus 1.4 plus 0.3 equals 2.6 seconds. That is just over the 2.5-second line, so Google rates it needs improvement. Now fix it. Caching cuts the server time from 0.9 to 0.4 seconds. Compressing the image cuts its load from 1.4 to 0.6 seconds. Render stays at 0.3 seconds. The new total is 0.4 plus 0.6 plus 0.3, which is 1.3 seconds. Two fixes saved 1.3 seconds and moved the page from needs improvement to good.
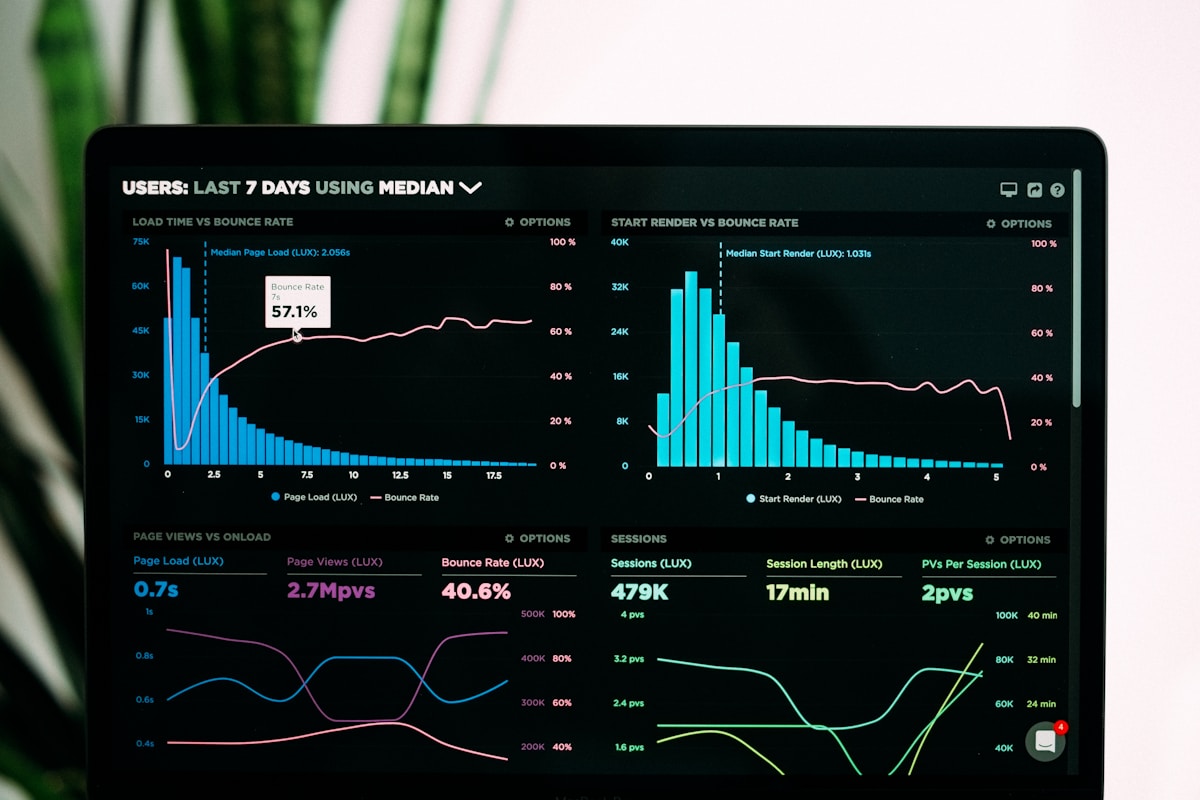
Speed matters because visitors leave. Google's research found 53% of mobile visitors leave a page that takes more than 3 seconds to load, and the probability of a bounce rises by 32% as load time goes from 1 second to 3 seconds. Real pages are slower than the target: the average page loads in 2.5 seconds on desktop but 8.6 seconds on mobile. Only 48% of websites pass all three Core Web Vitals on mobile, and 56% on desktop.
Measure your page with Google PageSpeed Insights, which is free. It shows both lab results, which simulate a test on one machine, and real-user results from the Chrome User Experience Report, which reflect actual visits. Fix the real-user numbers first, because those are what Google judges and what your visitors feel.
The fastest fixes are the simplest. Compress images before you upload them. Turn on caching so repeat visitors do not download everything again. Remove plugins and scripts you do not use. Use fast hosting, because a slow server caps everything else: if your TTFB is already 1.5 seconds, no image fix can bring your LCP under 2.5 seconds.
Q: What is a good page load time?
A: A Largest Contentful Paint of 2.5 seconds or less. Under 1.5 seconds is excellent, and over 4 seconds is poor.
Q: What are the Core Web Vitals thresholds?
A: LCP 2.5 seconds or less, INP 200 milliseconds or less, and CLS 0.1 or less. A page passes when all three are good for at least 75% of visits.
Q: How do I check my page load time?
A: Use Google PageSpeed Insights. It is free and shows both lab results and real-user data from the Chrome User Experience Report.
Q: What slows a page down the most?
A: Usually large uncompressed images and a slow server. Caching and image compression are the two fixes that save the most time for the least effort.
More from LuxeLiving 768